
Understanding Technical Chart Analysis in Financial Markets
12/7/20254 min read
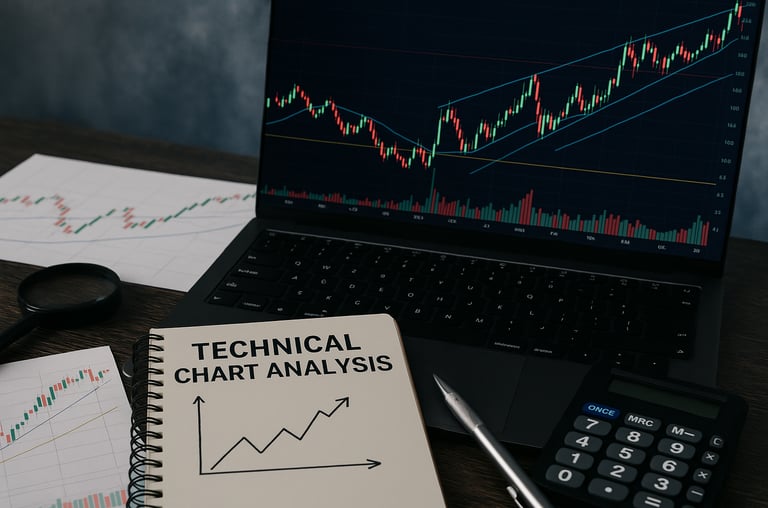
Introduction to Technical Chart Analysis
Technical chart analysis is a methodology used by traders and analysts to evaluate financial market trends and make informed trading decisions. At its core, technical analysis relies on charting tools to visualize price movements over time, allowing market participants to identify patterns that may indicate future price behavior. This approach primarily focuses on historical price data, which contrasts with fundamental analysis that examines a company's financial health and economic factors.
One of the key concepts in technical chart analysis is the identification of trends. Trends can be upward, downward, or sideways, and recognizing these movements is critical for traders seeking to capitalize on shifts in the market. Additionally, price patterns play a significant role in this analysis. Patterns such as head and shoulders, double tops, and flags provide traders with insights into potential market reversals or continuations, thereby enabling them to strategize their trades effectively.
The significance of technical analysis cannot be overstated. Traders utilize this approach not only to determine the optimal entry and exit points for trades but also to enhance their risk management strategies. By analyzing charts, traders can minimize potential losses and maximize profitability, differentiating themselves from others who may primarily rely on fundamental data. Furthermore, technical chart analysis allows for a more systematic approach to trading, helping traders maintain discipline when navigating the often volatile financial markets.
With the rise of digital trading platforms, several trending terms associated with technical chart analysis have gained traction. Keywords such as 'candlestick patterns', 'moving averages', and 'support and resistance levels' are commonly searched by those looking to refine their technical skills. As the landscape of trading continues to evolve, mastering the principles of technical analysis will undoubtedly remain a key component of successful trading strategies.
Types of Charts and Their Uses
In the realm of technical analysis, charts serve as critical tools for visualizing price movements and trends in financial markets. The three most commonly used chart types are line charts, bar charts, and candlestick charts, each providing unique insights and uses depending on a trader's strategy.
Line charts are perhaps the simplest of the three, representing price movements over a specified time period by connecting closing prices with a continuous line. This type of chart is particularly effective for spotting general trends and overall price movement. Traders often prefer line charts for their clarity and ease of interpretation, especially when analyzing longer time frames.
Bar charts, on the other hand, offer a more in-depth analysis of price action. Each bar represents the opening, closing, high, and low prices over a set time interval. This allows traders to capture the volatility and range of price movements during that time. Bar charts are beneficial when a detailed understanding of price fluctuation is required, as they provide insights into market sentiment and potential reversal points.
Candlestick charts are renowned for their aesthetically pleasing appearance and rich information content. Each candlestick represents price action for a specific period, showcasing the open, close, high, and low within its body and wicks. The colors of the candlesticks—commonly green for bullish and red for bearish periods—provide immediate visual cues about market momentum. Traders often favor candlestick charts for their ability to reveal patterns and predictive signals that may indicate future price movements.
In conjunction with these charts, important indicators such as moving averages or volume analysis can enhance trading strategies. For example, using moving averages on a candlestick chart can help identify trends and support or resistance levels. As traders choose the appropriate type of chart, it is crucial to align it with their overall trading strategy, thus facilitating more informed decision-making in the markets.
Key Indicators and Patterns in Technical Analysis
In the realm of technical analysis, several key indicators and patterns serve as vital tools for traders seeking to predict market movements. Understanding these elements can significantly influence trading decisions and overall market strategy. One of the foundational concepts in technical analysis is the identification of support and resistance levels. Support refers to the price point where a stock tends to stop falling and often rebounds, while resistance indicates a level where prices tend to stop rising and may decline. Recognizing these levels allows traders to make informed decisions regarding entry and exit points.
Trends are another critical aspect of technical analysis. A trend can be upward, downward, or sideways, and comprehending the direction of market momentum is indispensable for effective trading. Traders utilize trend lines to visualize these movements, helping them leverage the identified direction to inform their trades. Identifying trends also involves looking at the duration and strength of movements to gauge market sentiment and potential reversals.
Chart patterns, such as head and shoulders or triangles, provide additional context for traders. The head and shoulders pattern often indicates a change in trend direction, whereas triangle patterns can signal continuation or reversal, depending on their formation. These patterns enable traders to anticipate future price movements based on historical behavior, thereby refining their trading strategies.
Additionally, in recent online searches, phrases related to these indicators, such as "technical analysis strategies" and "support resistance tips," have gained traction. Integrating these fundamental tools into a trading plan allows for enhanced market understanding and more calculated risk management. Historical examples underscore the efficacy of these indicators, with many successful trades relying on these tried-and-tested techniques.
Getting Started with Technical Analysis: Resources and Recommendations
Embarking on the journey of technical analysis in financial markets requires access to quality resources and platforms that support practical learning. Many tools are available designed to enhance one’s understanding and application of chart analysis. A good starting point is to explore various online platforms that offer fundamental knowledge and advanced analytics for both beginners and seasoned traders.
One highly recommended crypto exchange is OKX. This platform provides users with a user-friendly interface, making it ideal for those just beginning to dip their toes into the world of cryptocurrency trading. OKX not only offers advanced charting tools but also a comprehensive instruction guide that helps traders understand various market indicators. It is specifically designed to cater to individuals looking to gain practical experience while trading.
In addition to trading platforms, educational resources are vital for building a strong foundation in technical analysis. One such resource is GO AI, an online academy dedicated to enhancing financial literacy. Their structured courses cover everything from the basics of chart patterns to complex trading strategies, making it a perfect fit for those seeking to improve their technical analysis skills. By integrating practical knowledge with theoretical concepts, GO AI aims to nurture proficient traders who are well-equipped to navigate the financial markets.
Utilizing these recommended platforms can significantly accelerate your journey into technical chart analysis. By starting with hands-on trading on OKX and supplementing your knowledge through the educational resources provided by GO AI, you will cultivate the skills necessary for success in finance. As you progress, continuous engagement with these resources will ensure you remain updated on evolving market trends and analysis techniques.
EconoTrade Insights
Learn. Trade. Grow.
Empowering financial freedom through smart education and trusted tools.
© 2025 ECONO TRADE INSIGHTS. All rights reserved.
About - https://econotradeinsights.com/about-us-financial-blogging
Contact - econotradeinsights@gmail.com
Disclaimer - https://econotradeinsights.com/disclaimer
Terms & Conditions - https://econotradeinsights.com/terms-and-conditions