
Mastering Financial Markets with SMC Chart Analysis: A Comprehensive Guide
12/8/20255 min read
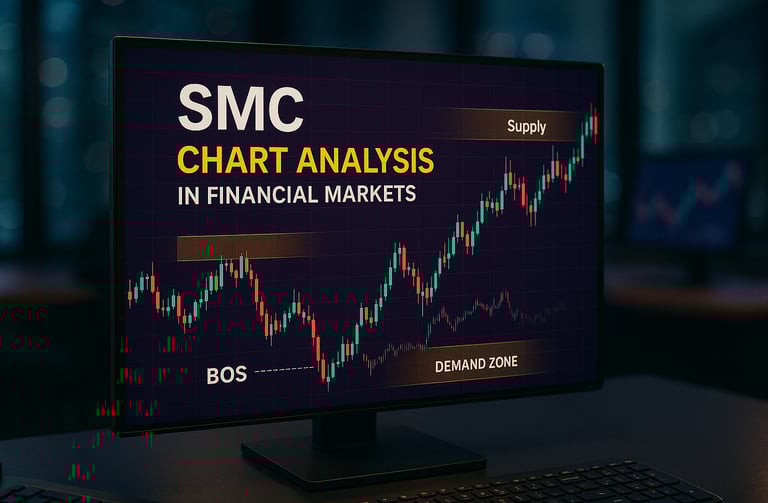
Understanding SMC Chart Analysis
SMC (Smart Money Concept) chart analysis is a powerful analytical tool employed within financial markets, enabling traders to interpret and predict market movements effectively. At its core, SMC focuses on the actions of institutional traders and smart money, the entities that typically possess superior market knowledge and resources compared to regular retail investors. By following the lead of these players, traders can enhance their decision-making processes, thereby improving the probability of successful trade outcomes.
The significance of SMC chart analysis lies in its ability to identify major market trends and pivotal turning points. It relies on the principle that the behavior of smart money provides valuable insights into the market's direction. For instance, when significant buying or selling activities are detected in the chart, it often signifies the dominance of institutional traders. These movements can suggest impending price shifts, allowing traders to position themselves advantageously. This method stands out in contrast to traditional analysis, as it focuses not merely on price patterns, but also on volume and order flow consistent with the activities of larger market participants.
Incorporating SMC analysis effectively requires a range of tools and indicators. Common tools include volume profiles, order flow charts, and liquidity zones, all of which provide essential data to assess market dynamics. Additionally, keywords such as ‘market structure,’ ‘liquidity,’ and ‘order blocks’ frequently surface in the context of SMC analysis, emphasizing the importance of understanding not only the price but also the underlying mechanics driving it.
In conclusion, SMC chart analysis is invaluable for traders wishing to navigate the complexities of financial markets more competently. By focusing on smart money movements and using the right tools, traders can discern market trends and improve their overall strategic approaches. Understanding these fundamentals sets the stage for a more informed trading experience.
Key Components of the SMC Chart Analysis
SMC chart analysis is an essential tool for traders looking to navigate financial markets effectively. Understanding its key components can significantly enhance one's ability to read and interpret market movements. The most critical elements of SMC chart analysis include liquidity pools, order blocks, and market structure. Each of these components plays a vital role in decision-making for traders.
Liquidity pools often serve as a focal point on the charts. These areas represent concentrations of orders that create opportunities when price action approaches. Traders can identify liquidity pools to predict potential reversals or continuations in the market. Recognizing where these liquidity zones are located allows for more informed trading decisions and situational awareness. Essentially, liquidity pools act as magnets for price movement, attracting traders looking to capitalize on high volume zones.
Order blocks are another significant component in SMC analysis. These are zones of accumulated buy or sell orders prior to a significant price movement. They function as areas where large financial institutions might have entered positions, thus establishing support or resistance levels. Understanding order blocks enables traders to anticipate possible price reactions and plan entries and exits accordingly, thereby improving risk management strategies.
Finally, market structure refers to the overall arrangement of price action and trends over time. Identifying market structure allows traders to align their strategies with the prevailing trend, whether it is bullish or bearish. Analyzing market structure involves observing higher highs and lower lows to confirm the trend direction. Successful traders leverage this knowledge to make timely decisions and avoid unnecessary losses.
By integrating these components into an SMC chart analysis routine, traders can better understand the underlying dynamics of the market, leading to more profitable outcomes. Visual aids, when incorporated, can greatly enhance comprehension, further solidifying the foundational principles of this analytical method.
Practical Applications of SMC Chart Analysis in Trading
Mastering SMC chart analysis can significantly enhance a trader's ability to make informed decisions in the financial markets. To implement SMC techniques effectively, traders should begin by selecting a suitable trading platform that supports advanced charting tools. Once a platform is established, the following step-by-step guidelines can aid in integrating SMC analysis into trading strategies.
First, traders should familiarize themselves with the fundamental concepts of SMC chart analysis, which includes identifying support and resistance levels, trend lines, and these market structures. By doing this, one can better understand price dynamics. Next, traders should practice plotting these structures on various time frames to observe how price actions manifest in different market conditions. For instance, utilizing a higher time frame to identify the overall trend while using lower time frames for entry and exit points can prove beneficial.
Identifying trade entries and exits relies heavily on the analysis of SMC charts. Traders can look for specific patterns, such as breakouts or pullbacks, which often indicate a potential buying or selling opportunity. A successful way to initiate a trade is by waiting for confirmation signals. For example, a strong candle close above a resistance level can serve as an entry signal, while a break below a support level may suggest a sell opportunity.
Numerous real-life case studies exemplify the success of SMC analysis in trading. Consider a trader who implemented SMC techniques during a recent bullish trend in the stock market. By carefully analyzing chart patterns and applying the SMC theory, the trader entered at a critical support level, subsequently experiencing a profitable exit after a surge in price. Such examples can greatly inspire beginners and intermediate traders alike.
For those eager to delve deeper into SMC chart analysis, several online resources and educational platforms are available. Engaging in courses that specialize in technical analyses will further enhance trading skills and foster a thorough understanding of market behaviors based on SMC principles. With consistent practice and continuing education, traders can master SMC chart analysis to make well-informed decisions in today's complex financial markets.
Take Control of Your Trading Journey
Having explored the fundamentals of SMC chart analysis, it is time for you to take action and truly own your trading journey. Understanding the intricacies of financial markets is an empowering endeavor, and utilizing SMC chart analysis can significantly enhance your trading strategies. With the right tools and resources at your fingertips, you can navigate the volatility of the market more effectively, making informed decisions that align with your financial goals.
As you venture into this exciting realm, we highly recommend using OKX as your primary crypto exchange. OKX is recognized for its reliability and user-friendly features, providing a comprehensive platform to trade a variety of cryptocurrencies. With advanced trading tools, competitive fees, and robust security measures, OKX facilitates a seamless trading experience. Whether you are a novice trader or an experienced investor, this exchange offers the required support to meet your needs efficiently.
Moreover, to deepen your understanding of financial markets and improve your proficiency in SMC chart analysis, consider enrolling in programs offered by GO AI. This platform specializes in dedicated educational resources related to chart analysis, allowing you to expand your knowledge base and sharpen your analytical skills. Engaging with such educational content will equip you with the insights needed to make knowledgeable trading decisions. Remember, enhancing your skills in chart analysis is crucial as it lays the foundation for constructing successful trading strategies.
In conclusion, by leveraging the resources provided by OKX and GO AI, you can embark on a well-informed trading journey. Taking control of your trading experience starts with embracing these tools and resources to navigate the complexities of financial markets adeptly. Start today, and set yourself on a path toward successful trading.
EconoTrade Insights
Learn. Trade. Grow.
Empowering financial freedom through smart education and trusted tools.
© 2025 ECONO TRADE INSIGHTS. All rights reserved.
About - https://econotradeinsights.com/about-us-financial-blogging
Contact - econotradeinsights@gmail.com
Disclaimer - https://econotradeinsights.com/disclaimer
Terms & Conditions - https://econotradeinsights.com/terms-and-conditions